Refer to the figure.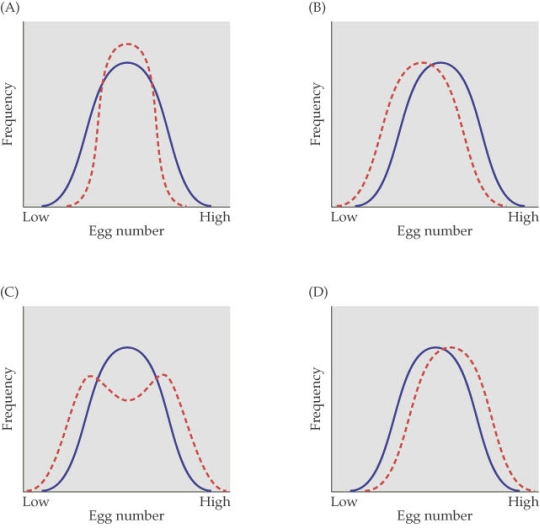
- The figure shows four cases of selection on egg number in a population of flour beetles. The solid blue line represents the frequency of the original population and the dashed red line represents the frequency distribution after eight generations. In which figure did the variance within the population for egg laying increase the most?
Definitions:
Initiative
The ability to assess and initiate things independently, often seen as a leadership quality.
Language Comprehension
The ability to understand spoken, written, or signed language.
Temporal Lobes
Regions of the cerebral cortex located beneath the temples, involved in processing auditory information and encoding memory.
Somatosensory Cortex
A region of the brain located in the parietal lobe, responsible for processing sensory information from the body, such as touch, temperature, and pain.
Q4: Suppose you are studying a population of
Q23: If perihelion were in July instead of
Q35: Imagine a moose in Grand Teton National
Q40: A typical lion pride<br>A) is sex-biased towards
Q48: Consider a population of birds that land
Q63: Which statement about the study of the
Q64: The table shows the survivorship, fecundity, and
Q71: You are one of a team
Q71: The use of specialized bacteria to help
Q74: Refer to the figure.<br><img src="https://d2lvgg3v3hfg70.cloudfront.net/TBO1115/.jpg" alt="