Multiple Choice
The graph shows a shift in investment demand to the right. This would MOST LIKELY occur: 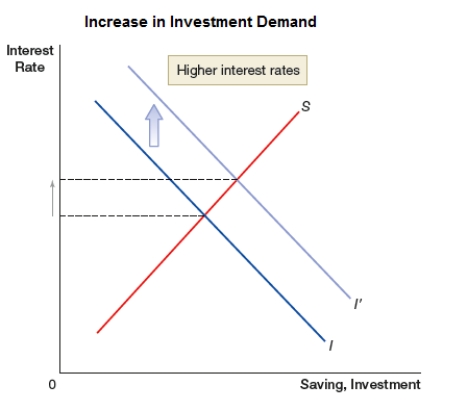
Definitions:
Related Questions
Q20: Theoretically, how do minimum wage laws contribute
Q22: The Venn diagram shows real variables versus
Q48: (Table 6: Real GDP and Population
Q59: Moral hazard tends to change:<br>A) behavior, not
Q60: What statistic measures the average price level
Q75: According to the classical dichotomy, real variables
Q79: _ for most of the increases in
Q84: What time period is typically used for
Q85: A news headline states "Higher interest rates
Q87: (Figure: LRAS0) In the figure, the economy