Multiple Choice
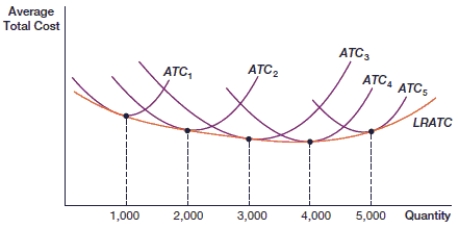
(Figure: Long-Run and Short-Run Average Total Cost Curves) In the figure, which level of output represents minimum efficient scale?
Definitions:
Related Questions
Q5: A firm's decision to shut down in
Q12: Along with the Department of Justice, the
Q21: _ profit is total revenue minus explicit
Q21: Compare the cooperative and non-cooperative solutions in
Q22: Firm XYZ produces paper products, which cost
Q43: (Figure: Producer Surplus 0) The price
Q47: Price fixing is most prevalent in the
Q71: _ is the business strategy of maximizing
Q79: (Figure: Price Ceiling 0) In the above
Q82: (Figure: Maximum Profit in Perfect Competition) In