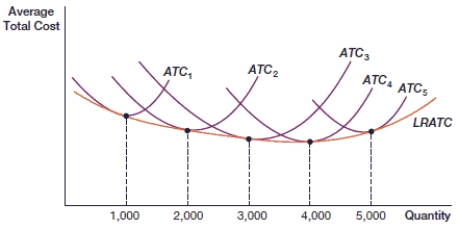
(Figure: Long-Run and Short-Run Average Total Cost Curves) In the figure, which level of output represents diseconomies of scale?
Definitions:
Delivery Costs
Expenses incurred by a company to transport its goods or services to the customer.
Product Cost
The total cost associated with producing a good, including raw materials, labor, and overhead.
Period Cost
Costs that are not directly tied to the production process and are expensed in the accounting period in which they are incurred.
Insurance Expired
The portion of an insurance premium that has been used up during the policy term, representing a cost for the period.
Q8: If a stock's P/E ratio is 14.64
Q18: When price elasticity of supply is _,
Q22: (Figure: Costs) In the figure, what level
Q23: (Figure: Strategic Decisions in a Sequential Game)
Q27: Explain why fixed costs exist only in
Q50: In the long run, if Britta's average
Q74: If a company's stock is selling for
Q77: If both players adopt a _ strategy,
Q94: An example of a commodity is:<br>A) beef.<br>B)
Q98: The automobile replaced the horse and buggy