Not Answered
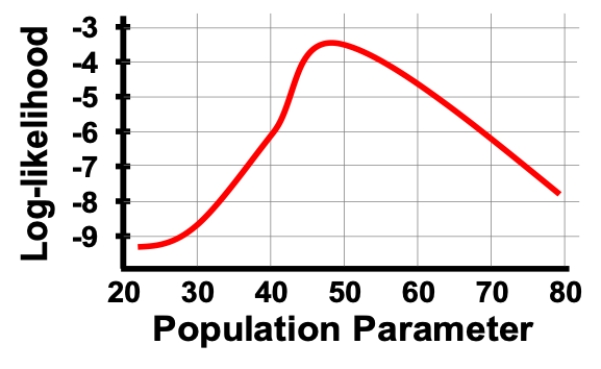
Consider a situation in which we plot the log-likelihood values for a range of parameter values as shown in the figure. What is the MLE and 95% confidence interval of the MLE based on this figure?
Definitions:
Related Questions
Q1: What is the common situation in which
Q6: Consider a situation in which Chris
Q11: When might we prefer to use rank
Q18: Logistic regression predicts the _ of occurrence
Q23: If you are a student looking ahead
Q24: The mean is the most important descriptive
Q30: Strip plots and violin plots are typically
Q44: Describe, using technical terms, why a larger
Q50: 20! > 99<sup>2</sup>
Q56: Consider estimating the 95% confidence interval for