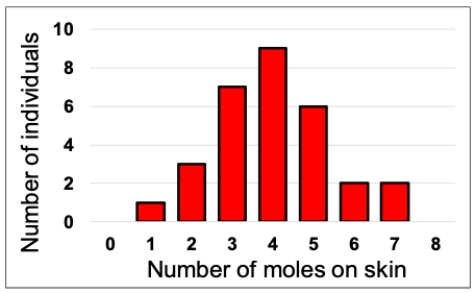
Consider the figure shown indicating the number of moles on the skin of a set of 30 patients examined by a dermatologist. Published reports claim that the mean number for the population these patients come from is 3.4 moles. Conduct a one-sample t-test on this data and determine whether this seems to be true. Assume a = 0.5. In your answer, present the following: your calculated t-value, an exact P-value using a computer or a range for the P-value using a table of critical values, and a statement about whether the population mean appears to be 3.4 or not based on the sample.
Definitions:
Client's Resistance
The opposition or reluctance of a client to engage with or continue with a service or intervention.
Participatory Research
A research approach that involves all stakeholders, especially those impacted by the issue being studied, in the research process.
Demographic Variables
Characteristics used to segment populations for the purpose of analysis, such as age, race, gender, income, and education level.
Q3: Log transformation is most useful for all
Q8: Barry Limited has the following figures
Q13: Based on the below figures, what
Q15: Which one of the following statements describes
Q28: Gabii Limited draws up its statement
Q34: Hallmarks of a non-normal population distribution include
Q39: Which of the following aspects of good
Q43: Which of the following is the main
Q45: Which of the following best describes when
Q50: A planned comparison when doing an ANOVA