Multiple Choice
(Figure: Network Market Demand Curve) The graph depicts a network market demand curve. Along the quantity axis (x axis) , casual users fall on the _____ portion and core users fall on the _____ portion.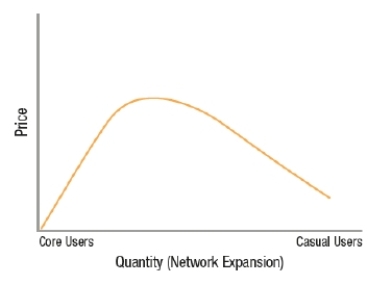
Definitions:
Related Questions
Q58: Before a critical mass of consumers is
Q86: The free rider problem is that<br>A) people
Q104: Market failures can arise when<br>A) externalities exist.<br>B)
Q157: Greenhouse gas emissions have been referred to
Q158: Consumers of public goods will<br>A) have an
Q163: Goals of the government when regulating network
Q242: The live band that plays nearby makes
Q262: All of these will lead to market
Q293: Since 1975, poverty rates in the United
Q333: The tragedy of the commons is MOST