Multiple Choice
(Figure: Peak-Load Pricing Model) The graph represents the market for a good that follows a peak-load pricing model. Which curve represents demand during a nonpeak period?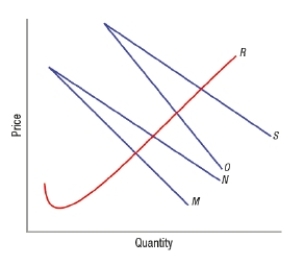
Definitions:
Related Questions
Q3: When a country imposes a new tariff
Q37: The socially optimal level of pollution occurs
Q40: Ignoring taxes and transfers, over the past
Q136: Education is one way to invest in
Q195: In the long run, interconnection in network
Q197: Cable customers often have to purchase ESPN,
Q216: Pollution can be reduced with lower<br>A) output.<br>B)
Q219: If education is correlated with earnings, why
Q259: Since 1929, corporate profits' share of national
Q293: (Figure: Understanding Network Good Markets) The graph