True/False
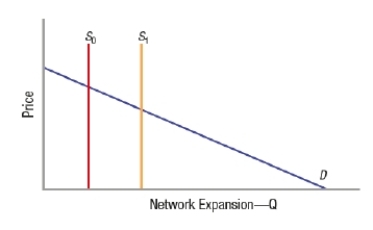
(Figure: Network Goods and Fixed Capacities) The graph represents a small network with a fixed capacity. If capacity decreases from S1 to S0, D rotates downward, and price decreases.
Definitions:
Related Questions
Q31: In 2017, around _ million people were
Q59: Which country notably suffered a negative spillover
Q240: The less centralized an environmental policy is,
Q255: An example of a lock-in strategy is
Q273: Network goods differ from other types of
Q288: (Figure: Determining Consumer and Producer Surplus) Based
Q290: Draw a graph with a network demand
Q327: (Figure: Externalities and Network Effects) Based on
Q330: What type of government policy is generally
Q353: Greyhound Lines offers a discount for bus