(Figure: Monopolists in Monopsony Markets) The graph depicts a firm that is a monopolist in the product market but a monopsony in the input market. Which curve represents the marginal revenue product of labor?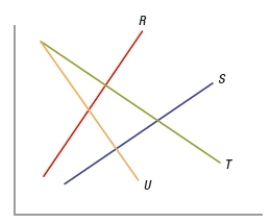
Definitions:
Fixed Costs
Costs that do not change with the amount of goods or services produced, such as rent, salaries, and insurance.
Break-Even Point
The point at which total costs and total revenue are equal, resulting in no net gain or loss.
Variable Cost
A cost that changes in proportion to the level of output or activity.
Variable Costs
Costs that vary directly with the level of production or output, such as materials and labor.
Q20: A study revealed that in nearly 100
Q32: Profit is important in achieving economic efficiency
Q37: The marginal product of capital curve has
Q49: (Table) The amount of labor and
Q102: Human capital theory suggests there is a
Q110: As your hourly wages increase, ceteris paribus,
Q116: Successful monopolistically competitive firms<br>A) generally earn higher
Q118: If a prisoner's dilemma game is repeated
Q130: If wages increase at a 5% rate
Q208: An increase in the price of capital