(Figure) The figure shows two supply curves for two different periods for the same product. If the price of the product increased from $20 to $25, the price elasticity of supply will be _____ in the short run and _____ in the long run using the midpoint method.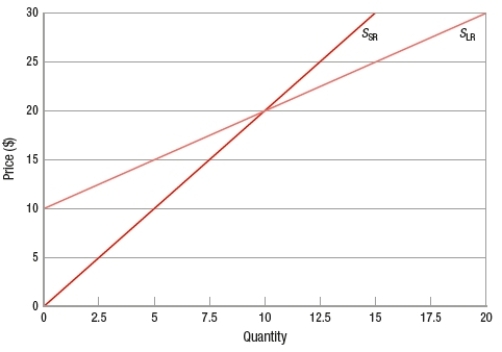
Definitions:
Marginal Cost
The cost added by producing one additional unit of a product or service, a critical concept in economics and decision making in business.
Average Total Cost
The total cost divided by the number of goods or services produced, indicating the average expense per unit.
Total Fixed Cost
The sum of all costs that remain constant regardless of the level of production or output.
Output Level
The quantity of goods or services produced within a given period by a business or economy.
Q19: Which graph shows an increase in quantity
Q36: A teaser is typically:<br>A) A short written
Q85: The current equilibrium price and quantity in
Q135: (Table) Based on the table, the
Q141: You have a weekend budget of $27,
Q207: The owner of a kayak tour business
Q212: (Table) Based on the table, assume
Q228: In the graph, which shows the market
Q234: (Figure: Interpreting Elasticity of Supply) How would
Q319: If you allocate your time between attending