The following figure shows curves for labor demand and labor supply.
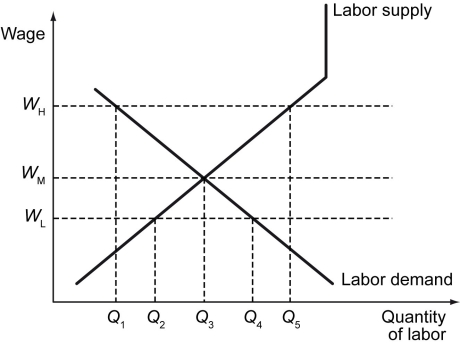
-Refer to the figure above.Why might we observe the wage rate to be at WH rather than at WM?
Definitions:
Silt
Fine-grained soil or sediment with particles smaller than sand and larger than clay, often carried by water and deposited as sediment.
Clay
A natural, earthy material composed of fine-grained minerals, often used in pottery, bricks, and sculpture, known for its plasticity when moist.
Gymnosperms
A group of seed-producing plants that includes conifers, cycads, Ginkgo, and gnetophytes, characterized by their naked seeds not enclosed in an ovary.
Angiosperms
A large group of plants characterized by having flowers and producing seeds enclosed within a fruit.
Q1: Refer to the scenario above.What would happen
Q2: Refer to the scenario above.If both economies
Q30: The top 10 percent of income earners
Q38: Which of the following statements is true?<br>A)
Q51: Consider a closed economy without the government.If
Q79: Compared to an economy with extractive institutions,an
Q88: Refer to the figure above.If a new
Q97: Refer to the figure above.What is the
Q138: Refer to the table above.Country A's unemployment
Q183: Collective bargaining can _.<br>A) reduce wages<br>B) increase