The following figure shows wage rate versus quantity of labor.
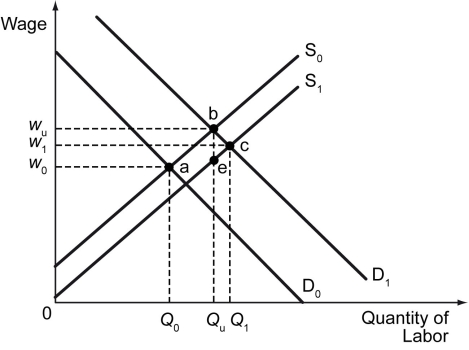
-Refer to the figure above.If S₀ is the supply of labor,D₀ is the labor demand curve during a cyclical downturn,and D₁ is the labor demand curve during a cyclical expansion,which expression best represents the natural level of employment?
Definitions:
Q14: If the natural rate of unemployment in
Q27: At a fixed level of worker productivity,_.<br>A)
Q67: Refer to the figure above.What is the
Q80: Refer to the scenario above.What is Beta
Q81: Given the situation above,what will happen to
Q125: Recovery after the recession of 2007-2009 was
Q175: Refer to the figure above.Which of the
Q192: An asset is said to be riskless
Q220: Refer to the scenario above.If the saving
Q227: Refer to the figure above.Assume that the