Multiple Choice
The table below shows the quantities of rice and wheat that two countries can produce in a year if they specialize in the production of each good.
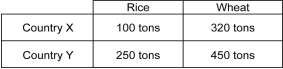
-Refer to the table above.The opportunity cost of producing 1 ton of rice in Country Y is ________.
Definitions:
Related Questions
Q19: Refer to the figure above.The equilibrium quantity
Q46: On a graph with real GDP growth
Q49: If the Fed promises to conduct a(n)_
Q51: Fears of an impending civil war in
Q73: The Bank of Romovia,which is the highest
Q76: Everything else being equal,a depreciation of the
Q94: Suppose that inflation were 6 percent and
Q111: Which of the following is a likely
Q115: In her calculation of the cost of
Q158: What was the main finding of Ramey's