The table below shows the quantities of rice and wheat that two countries can produce in a year if they specialize in the production of each good.
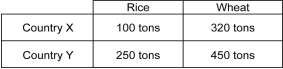
-Refer to the table above.The opportunity cost of producing 1 ton of wheat in Country X is ________.
Definitions:
Class-by-Class Basis
A method of analysis or reporting where items are categorized and evaluated separately in distinct classes or groups.
Initial Recognition
The process of recording an asset or liability in the financial statements at the time it is incurred or acquired.
Measurement Basis
The method or approach used in accounting to determine the value at which assets, liabilities, income, and expenses are recorded in the financial statements.
Cost
The value of money that has been used up to produce something or deliver a service, and hence is not available for use anymore.
Q37: What is the disadvantage of using an
Q54: The growth rate of productivity is the
Q56: Refer to the scenario above.After this transaction,Bank
Q81: International trade flows only in goods,not services.
Q98: Suppose a country's net exports equal $1.9
Q116: Which feature of economic fluctuations was not
Q135: The Great Depression and World War II
Q135: The exchange rate of a currency in
Q164: If the Fed buys bonds from a
Q166: The Federal Reserve determines and implements the