Multiple Choice
Figure 10-5 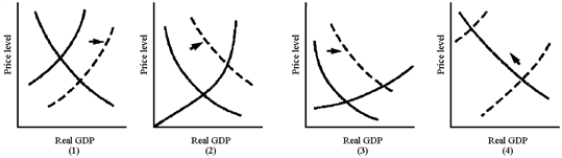
-In Figure 10-5, which graph best illustrates the situation of an economy reacting to an inflationary gap through an increase in wage levels?
Definitions:
Related Questions
Q17: How does a tax cut affect the
Q18: A higher price level would mean _
Q25: The reason for the multiplier effect is
Q34: Government regulations to insure the safety of
Q93: Fiscal policy is the use of taxes
Q114: Using the standard 45-degree line diagram,how does
Q127: Increases in productivity are caused by<br>A) better
Q180: If a bank has $1,000,000 in reserves
Q202: The slope of the aggregate demand curve
Q206: If aggregate quantity supplied exceeds aggregate quantity