Figure 18-3
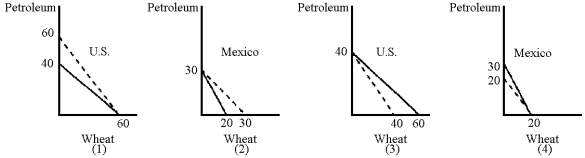
-In Figure 18-3, the solid lines represent the respective production possibilities curves for the United States and Mexico.Which graphs show the correct consumption possibilities curves (dashed lines) after an agreement is reached to trade 1 unit of wheat for 1 unit of petroleum?
Definitions:
Depreciation Charge
An accounting expense recorded to allocate the cost of a tangible asset over its useful life.
Book Value
The value of an asset according to its balance sheet account balance, often different from its market value.
Controllable Margin
A financial metric that reflects the amount of profit a business can potentially control or influence directly, typically by managing costs or increasing sales.
Q5: In Figure 17-8,which of the following movements
Q28: Under the gold standard,<br>A) each nation had
Q35: If Japan imposes a quota on imports
Q78: If budget deficits shift the money demand
Q86: Because the United States is highly integrated
Q89: Which of the following is t regarding
Q94: Politicians and economists who are generally conservative
Q151: From 1992,America's trade performance was marked by
Q159: The purpose of fiscal policy should be
Q184: The Bretton Woods agreements in 1944<br>A) established