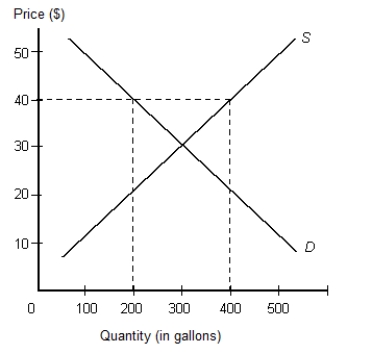
The below figure shows the demand and supply curves in the market for gasoline. The price and quantity at the point of intersection of the demand and supply curves is $30 and 300 gallons respectively.Figure 3.6

-In general, the purpose of markets is to facilitate the exchange of goods and services between buyers and sellers.
Definitions:
Joint Costs
Costs incurred during the production process that are shared among two or more products.
Allocating Joint
The process of distributing joint costs to different products or departments that share common processes or resources.
Common Methods
Standardized approaches or techniques applied in various fields or processes, such as accounting or research.
Conversion Costs
Expenses incurred in the process of converting raw materials into finished products, including labor and overhead costs.
Q3: Scarcity is a result of an unfair
Q10: Economic growth can be illustrated by an
Q12: With regard to the law concerning nuisance:
Q47: When a household owns shares of stock,
Q57: A trade deficit involves:<br>A) net flows of
Q72: Which of the following represents the amount
Q75: According to the law of supply, if
Q87: Refer to Scenario 7.1. According to the
Q90: An increase in stock prices can be
Q114: Who among the following individuals will not