Multiple Choice
The figure given below represents the business cycle of an economy.?Figure 7.1
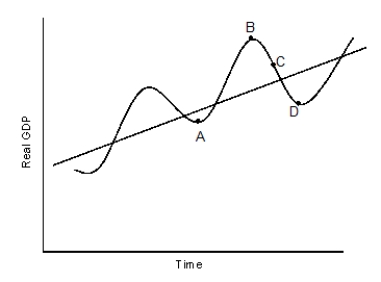
-Refer to Figure 7.1. At point D, lagging economic indicators should show that:
Definitions:
Related Questions
Q19: Refer to the data in Scenario 7.2.
Q22: Refer to Table 9.3. Compute the marginal
Q23: The Great Depression was the most severe
Q34: Refer to Scenario 5.1. Gross national product
Q47: In Figure 9.2, consumption equals disposable income:<br>A)
Q55: If the U.S. dollar price of the
Q57: Refer to Figure 2.1. Identify the correct
Q87: What is the marginal propensity to consume
Q87: Most countries tend to follow only one
Q104: A key assumption of the Keynesian model