Multiple Choice
The figure given below represents the equilibrium real GDP and price level in the aggregate demand and aggregate supply model.
Figure 8.3
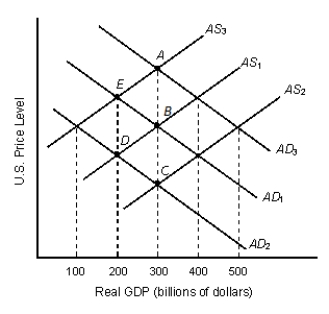
-Consider Figure 8.3. Which of the following is most likely to have led to the movement from point B to point E?
Definitions:
Related Questions
Q28: Ceteris paribus, a downward shift in the
Q43: Compared to the government in a typical
Q54: According to the World Bank, low-income economies
Q67: Which of the following is true of
Q71: If the U.S. dollar price of one
Q72: The marginal propensity to consume (MPC) is
Q75: Which of the following is a determinant
Q79: Mortgages with variable interest rates:<br>A) increase the
Q91: A trade deficit experienced by a country
Q94: A price floor is the minimum price