Multiple Choice
The figure given below represents the leakages and injections in an economy.
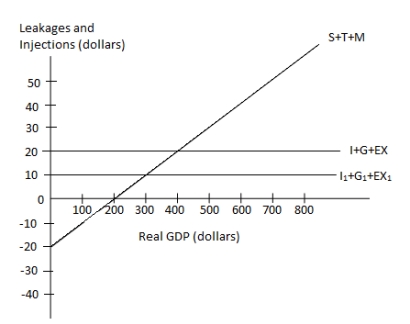
Figure 10.2
 In the figure:
I, I1: Investment;
G: Government spending;
EX, EX1: Exports;
T: Taxes; and
M: Imports.
-According to Figure 10.2, real GDP of $200 indicates a point where:
Definitions:
Related Questions
Q4: An increase in aggregate demand due to
Q9: Refer to Figure 9.1. An increase in
Q18: In high-inflation countries, workers prefer to spend
Q58: The concept of double coincidence of wants
Q60: Which of the following is true about
Q67: Which of the following is most likely
Q79: Suppose the interest rate on a bond
Q88: The wealth effect, the interest rate effect,
Q108: Refer to Table 10.1. If real GDP
Q132: Which of the following can be considered