The figure given below represents the new classical long run and short run Phillips curve measuring inflation rate on vertical axis and unemployment rate on horizontal axis.
Figure 15.2
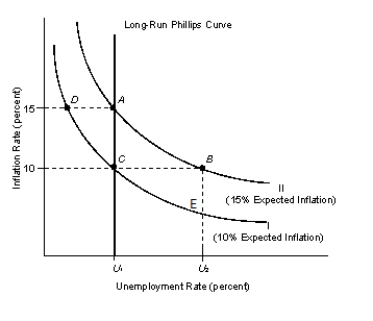
-Refer to Figure 15.2. Assume that the economy is now at point B. If government officials announce and carry out a policy that will maintain the inflation rate at 15 percent, we would expect:
Definitions:
Measured
Quantitatively determined, assessed, or quantified through observation or instrumentation.
Emotion
A complex psychological state that involves a subjective experience, a physiological response, and a behavioral or expressive response.
Predicted
In the context of research, predicted refers to the expected outcomes or behaviors based on established theories or models prior to conducting an experiment or observational study.
Biological Basis
The underlying physiological and genetic factors that contribute to an individual's characteristics, behaviors, or conditions.
Q14: Which of the following schools of thought
Q15: If natural gas is replaced by solar
Q22: The Federal Reserve System is an independent
Q45: If the Fed aims to achieve a
Q48: Which of the following multinational agreements allows
Q50: Which of the following government agencies oversees
Q51: Which of the following was sanctioned by
Q76: According to the new classical school, an
Q76: When the government raises spending to promote
Q109: A $1,000 price tag on a stereo