The figure below shows the demand (D) and supply (S) curves of a good produced domestically in an economy as well as traded in the international market.Figure 21.1
In the figure,
P1: Price of the good in the international market.P2: Price of the good in the domestic market after the imposition of tariff by the government.P3: No-trade price of the good in the domestic market. 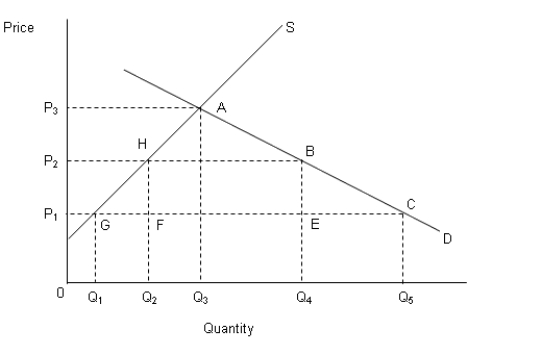
-If the world price of a good is lower than its domestic equilibrium price, the country will:
Definitions:
Q5: According to the Heckscher-Ohlin model:<br>A) a relatively
Q6: The gold standard ended with the:<br>A) rise
Q31: The theory of comparative advantage:<br>A)helps to analyse
Q51: 'It is not fair to increase the
Q70: The United States has no comparative advantage
Q70: Land resource includes farming land,forestry and fishery
Q85: When you are calculating how long it
Q94: Compare two economies A and B that
Q102: A customs union is an organization of
Q104: To have significant foreign direct investment, a