The figure given below depicts the demand and supply of Brazilian reals in the foreign exchange market. Assume that the market operates under a flexible exchange rate regime.
Figure 21.1
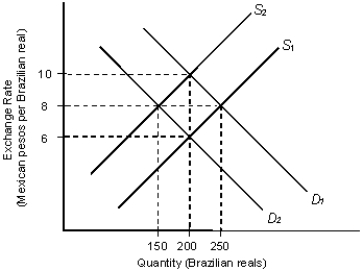
In the figure:
D1 and D2: Demand for Brazilian reals
S1 and S2: Supply of Brazilian reals
-Refer to Figure 21.1. Assume that the initial equilibrium exchange rate is 6 pesos per real. Other things remaining equal, an increase in the number of Brazilian tourists to Mexico is most likely to:
Definitions:
Cause-and-Effect Relationship
Describes a relationship where one event (the cause) makes another event happen (the effect).
Psychological Tests
Procedures used to measure and evaluate personality traits, emotional states, aptitudes, interests, abilities, and values.
Personality Traits
Enduring characteristics that describe an individual's behavior.
Emotional States
The internal conditions that arise in response to external stimuli, influencing mood and feelings.
Q1: In the United States, a "buy American"
Q12: Movement along the production possibilities curve shown
Q14: 'Coal mining companies anticipate an additional tax.'
Q17: If average costs of production decline with
Q32: Anything that changes the amount a firm
Q83: In many less-developed countries, per capita GDP
Q103: Less-developed countries are experiencing rapid population growth
Q106: Commercial policy is government policy that influences:<br>A)
Q106: Nations trade what they produce in excess
Q116: Assume that a Chrysler automobile sells for