Exhibit 7-1 Total revenue and total cost graph
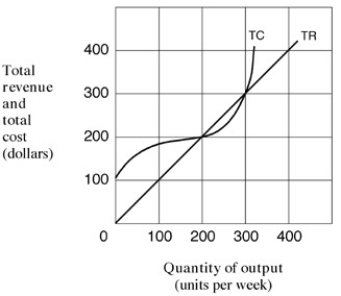
-In Exhibit 7-1,economic profit for the firm is at a maximum when output per week equals:
Definitions:
Irrational Choice
Making decisions that go against or do not align with the rational decision-making model, often leading to less optimal or desirable outcomes.
Parallel Shift
occurs when a graph's curve moves left or right without changing its shape, often used in reference to demand or supply curves.
Relative Prices
The price of one good or service compared to another, reflecting its scarcity or value in exchange.
Indifference Curve
A graph showing different bundles of goods between which a consumer is indifferent, highlighting the trade-offs in consumption preferences.
Q2: If a firm has total revenue of
Q21: As shown in Exhibit 5-4,assume the government
Q36: Suppose the price of a bus ticket
Q36: Legal barriers protect firms from:<br>A)losses.<br>B)high prices.<br>C)potential competitors.<br>D)taxes.
Q52: As presented in Exhibit 9-l,the short-run profit
Q97: The Carbon Pollution Reduction Scheme (CPRS)was authored
Q97: Marginal cost initially decreases because:<br>A)marginal product is
Q99: A farm can produce 10 000 bushels
Q110: The long-run supply curve for a competitive
Q119: As shown in Exhibit 6-3,the marginal product