Figure 8.1 depicts the supply and demand schedules of calculators for Greece, a "small" country that is unable to affect the world price. Greece's supply and demand schedules of calculators are respectively depicted by SG and DG. Assume that Greece imports calculators from either Germany or France. Suppose Germany is the world's low-cost producer who can supply calculators to Greece at $20 per unit, while France can supply calculators at $30 per unit.
Figure 8.1. Effects of a Customs Union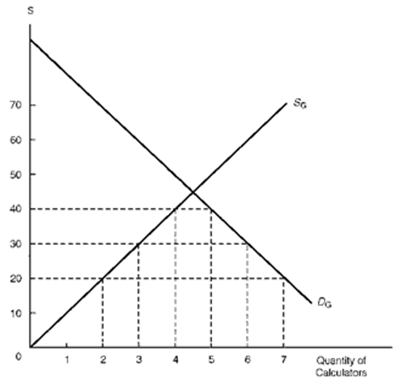
-Consider Figure 8.1.The value of the trade creation effect resulting from the Greece/France customs union equals
Definitions:
Standard Deviation
Standard deviation is a measure that quantifies the amount of variation or dispersion of a set of data values from their mean.
Standard Normal Random Variable
A normally distributed random variable characterized by a mean of 0 and a standard deviation of 1.
P
A probability value that reflects the likelihood of obtaining test results at least as extreme as the results actually observed, during the assumption that the null hypothesis is correct.
z
A statistical measure that represents the number of standard deviations a data point is from the mean.
Q5: For the United States, suppose the annual
Q8: Under a system of floating exchange rates,
Q10: _ refers to highly educated and skilled
Q45: Consider Figure 5.4. The cost of the
Q68: The protective effect of a tariff occurs
Q86: The deadweight losses of an import tariff
Q87: According to the normal-trade-relations (most-favored-nation) principle, if
Q117: Suppose that the production of $500,000 worth
Q126: Consider Figure 5.5. Assuming that the revenue
Q127: Consider Figure 5.4. The increase in Venezuelan