The income levels vary by race and educational attainment. To examine this inequality in the income, data have been collected for 7 different years on the median income earned by an individual based on the race and education.

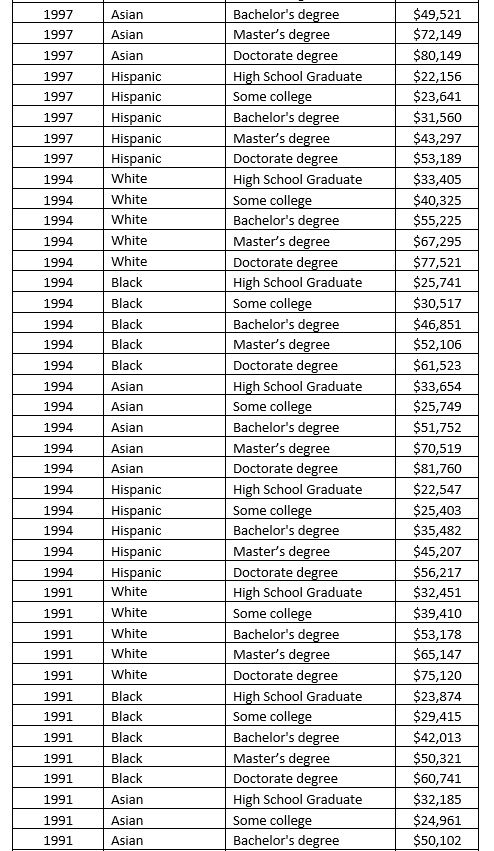
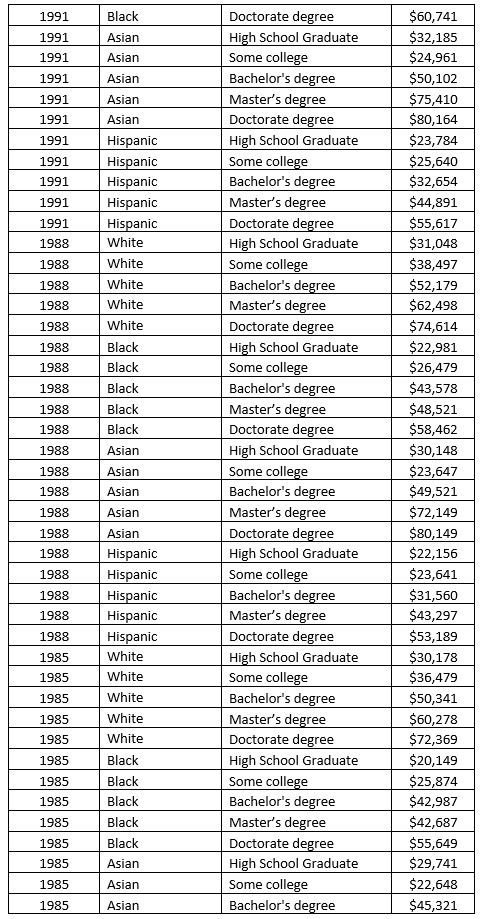
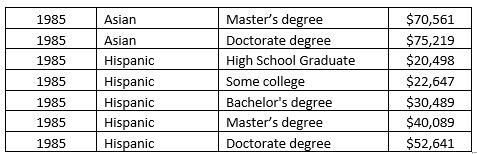
a. Sort the PivotTable data to display the years with the smallest sum of median income on top and the largest on the bottom. Which year had the smallest sum of median income? What is the total income in the year with the smallest sum of median income?
b. Add the Racial Demographic to the Row Labels in the PivotTable. Sort the Racial Demographic by Sum of Median Income with the lowest values on top and the highest values on bottom. Filter the Row Labels so that only the year 2003 is displayed. Which Racial demography had the smallest sum of median income in the year 2003? Which Racial demography had the largest sum of median income in the year 2003?
Definitions:
Attribute Preference Rule
A decision-making heuristic where consumers select products or services based on a subset of relevant features that they prefer.
Elimination-by-aspects
A decision-making model in which choices are systematically rejected based on the absence of specific, desirable attributes.
Lexicographic Rule
A decision rule where choices are compared based on the most important attribute first, then the second most important, and so on, until a decision is made.
Heuristic
A mental shortcut that allows people to solve problems and make judgments quickly and efficiently.
Q5: Bernard-Soulier syndrome is a bleeding disorder caused
Q7: Jeff is willing to invest $5000
Q9: Advanced analytics in a few instances refers
Q13: Neonatal vomiting and diarrhea and failure to
Q14: Peripheral blood cytopenia is a feature of<br>A)
Q24: The patient with a brain concussion experienced
Q30: Which of the following is true of
Q34: The values for random variables in a
Q45: Binary variables are identified with the _designation
Q51: Sunseel Industries produces two types of raw