A bank is interested in identifying different attributes of its customers and below is the sample data of 150 customers. In the data table for the dummy variable Gender, 0 represents Male and 1 represents Female. And for the dummy variable Personal loan, 0 represents a customer who has not taken personal loan and 1 represents a customer who has taken personal loan.

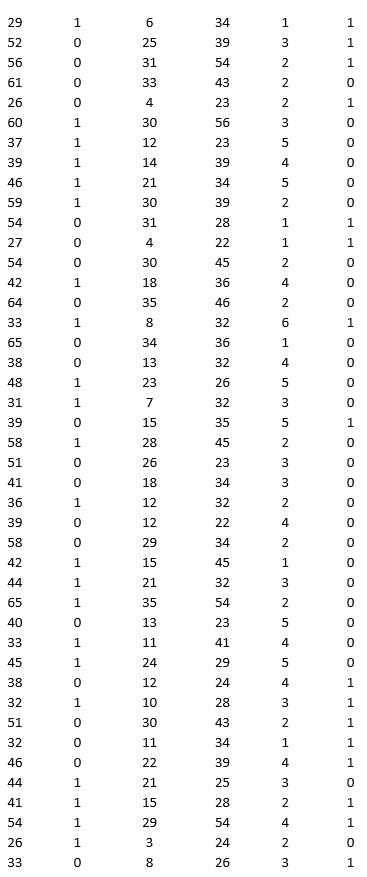
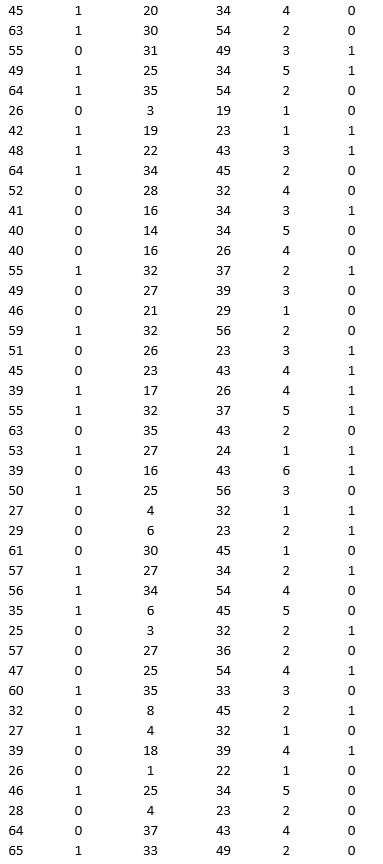
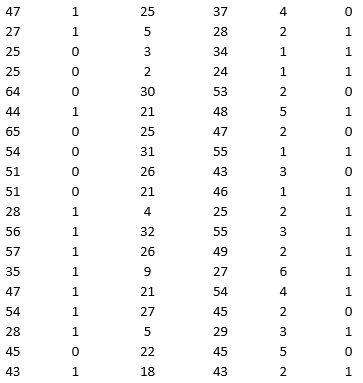
Partition the data into training (50 percent), validation (30 percent), and test (20 percent) sets. Fit a classification tree using Age, Gender, Work experience, Income (in 1000 $), and Family size as input variables and Personal loan as the output variable. In Step 2 of XLMiner's Classification Tree procedure, be sure to Normalize input data and to set the Minimum #records in a terminal node to 1. In Step 3 of XLMiner's Classification Tree procedure, set the maximum number of levels to seven. Generate the Full tree, Best pruned tree, and Minimum error tree. Generate lift charts for both the validation data and the test data.
a. Interpret the set of rules implied by the best pruned tree that characterize the customers who have taken personal loan.
b. For the default cutoff value of 0.5, what is the overall error rate, Class 1 error rate, and Class 0 error rate of the best pruned tree on the test data? Interpret these respective measures.
c. Examine the decile-wise lift chart for the best pruned tree on the test data. What is the first decile lift? Interpret this value.
Definitions:
Family-nurse Relationship
A dynamic and essential connection between a nurse and the patient's family members, characterized by mutual respect, collaboration, and communication to enhance the patient's care.
Peer Review
When nurses functioning in the same capacity appraise the quality of care or practice performed by other equally qualified nurses.
Q8: Reference - 10.1. Which of the following
Q13: This esophageal carcinoma developed in a 65-year-old
Q15: Assuming that a vaccination will be discovered
Q16: The objective function for a linear optimization
Q18: Consider the stock return data given below.<br>
Q27: The linear program that results from dropping
Q44: _ refer to the probabilities of the
Q50: The _ function pairs each element of
Q59: A chocolate making company largely produces one
Q59: Which of the following is a commonly