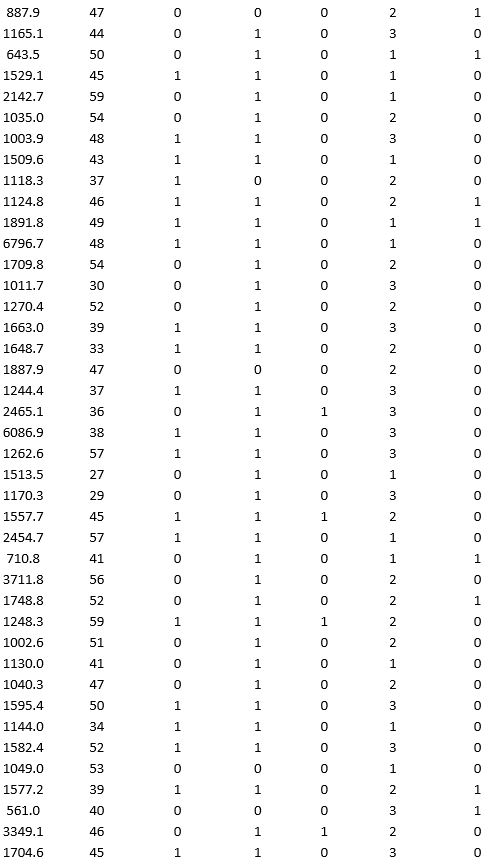
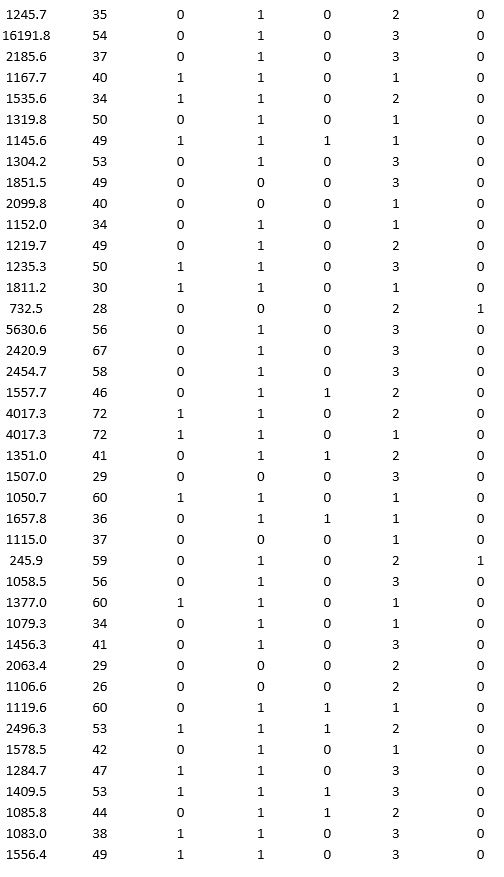
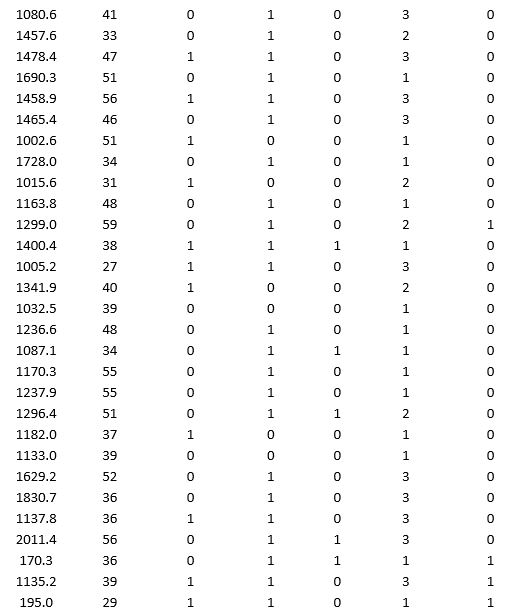
A bank wants to understand better the details of customers who are likely to default the loan. In order to analyze this, the data from a random sample of 200 customers are given below:

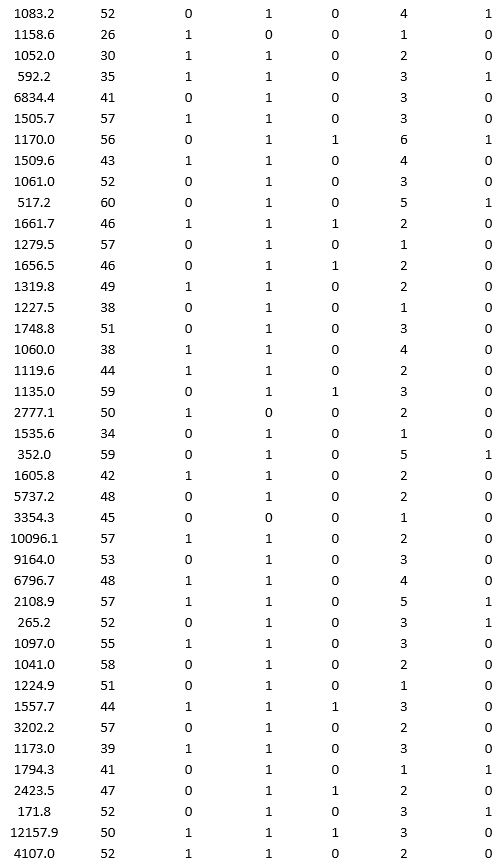
In XLMiner's Partition with Oversampling procedure, partition the data so there is 50 percent successes (Loan default) in the training set and 40 percent of the validation data are taken away as test data. Construct a logistic regression model using Loan default as the output variable and all the other variables as input variables. Perform an exhaustive-search best subset selection with the number of best subsets equal to 2. Generate lift charts for both the validation data and test data.
a. From the generated set of logistic regression models, select one that is a good fit. Express the model as a mathematical equation relating the output variable to the input variables. Do the relationships suggested by the model make sense? Try to explain them.
b. Using the default cutoff value of 0.5 for your logistic regression model, what is the overall error rate on the test data?
c. Examine the decile-wise lift chart for your model on the test data. What is the first decile lift? Interpret this value.
Definitions:
Therapy Process
A systematic method of treating psychological disorders and emotional difficulties, through a structured interaction between a therapist and a client.
Major Depressive Disorder
An emotional well-being issue characterized by a never-ending depressed state or lack of zest in activities, causing notable disturbances in daily habits.
Selective Serotonin Reuptake Inhibitors
A class of drugs commonly used to treat depression and anxiety disorders by increasing the levels of serotonin in the brain.
Regression Toward the Mean
A statistical phenomenon that results when unusually large or small measurements tend to be followed by measurements that are closer to the average.
Q1: Cardiac disease is found in 20% to
Q2: Sansuit Investments is deciding on future investment
Q9: During a mini-epidemic of Shigella, a 5-year-old
Q11: All the three descriptive, predictive, and prescriptive
Q16: The deletion of two α -globin chains
Q20: The range of computer-generated random numbers is
Q21: At change of shift,two nurses (one from
Q43: Which of the following are necessary to
Q55: The moving averages and exponential smoothing methods
Q56: Which of the following conclusions can be