A bank is interested in identifying different attributes of its customers and below is the sample data of 150 customers. In the data table for the dummy variable Gender, 0 represents Male and 1 represents Female. And for the dummy variable Personal loan, 0 represents a customer who has not taken personal loan and 1 represents a customer who has taken personal loan.

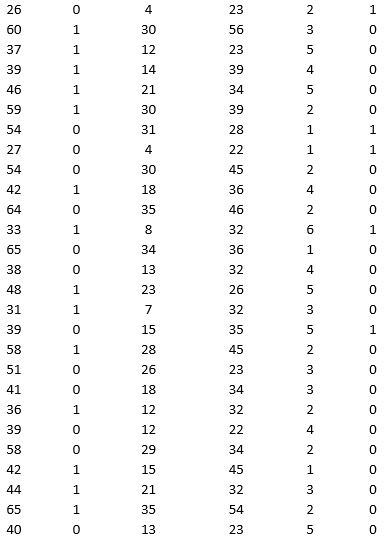
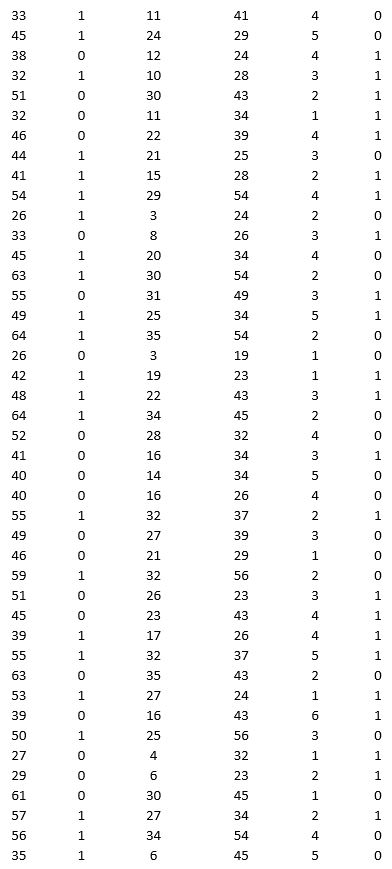
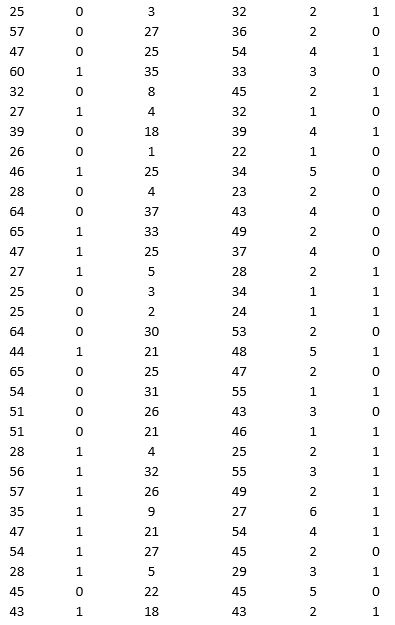
Partition the data into training (50 percent), validation (30 percent), and test (20 percent) sets. Classify the data using k-nearest neighbors with up to k = 10. Use Age, Gender, Work experience, Income (in 1000 $), and Family size as input variables and Personal loan as the output variable. In Step 2 of XLMiner's k-nearest neighbors Classification procedure, be sure to Normalize input data and to Score on best k between 1 and specified value. Generate lift charts for both the validation data and test data.
a. For the cutoff probability value 0.5, what value of k minimizes the overall error rate on the validation data? Explain the difference in the overall error rate on the training, validation, and test data.
b. Examine the decile-wise lift chart on the test data. Identify and interpret the first decile lift.
c. For cutoff probability values of 0.5, 0.4, 0.3, and 0.2, what are the corresponding Class 1 error rates and Class 0 error rates on the validation data?
Definitions:
Price Floor
A government- or authority-imposed minimum price that can be charged for a good or service, intended to prevent prices from falling too low.
Equilibrium Price
The price at which the quantity of a good or service demanded by consumers matches the quantity supplied by producers, resulting in no surplus or shortage.
Market Price
The actual selling price of a good or service in the market at which it can be bought or sold.
Surplus
The amount by which quantity supplied exceeds quantity demanded, often resulting in excess goods and a decrease in prices.
Q3: For the following sample data, compute the
Q4: Ingestion of aflatoxin, a toxin from Aspergillus
Q6: The nurse is teaching a patient from
Q12: A 60-year-old man who complained of persistent
Q15: Assuming that a vaccination will be discovered
Q19: The yearly sales (in millions of dollars)
Q20: The range of computer-generated random numbers is
Q23: A constraint involving binary variables that does
Q32: _ is a constraint requiring that two
Q37: All the values of computer-generated random numbers