Following is a table of data collected from one section of an 8 a.m.physiology lab.There were 20 students present, 10 men and 10 women.Information collected from the students included their height, weight, age, gender, and resting pulse rate.In addition, the students were surveyed to see if they smoked cigarettes, considered themselves "regular exercisers," if they had consumed caffeine the morning of the lab, and if they had eaten breakfast that day.A "y" or "n" (yes or no) was recorded to indicate their answers.Each student did "jumping jacks" for 5 minutes and recorded the time required to regain their resting heart rate, which is listed on the table as "recovery time." Finally, each student participated in an exercise designed to measure their reaction time (in milliseconds) in catching an object dropped by a lab partner according to specified criteria.Use this table to answer the following questions.Ignore statistical problems caused by small sample size, and so on.
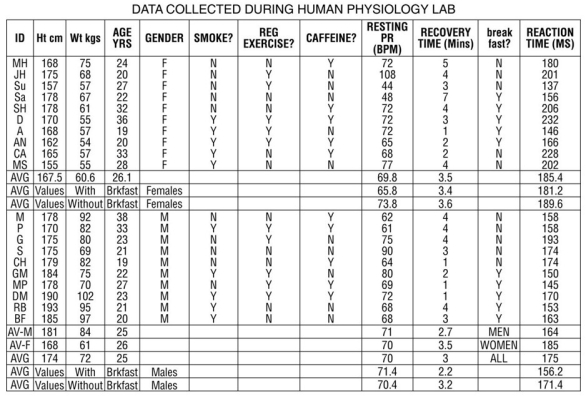
Table 1.3
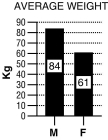
Figure 1.3
For these questions, the data were separated and analyzed by gender.
-Refer to Table 1.3 and Figure 1.3 (bar graph).
A.Write a hypothesis regarding gender and weight.
B.What is the dependent variable? What is the independent variable?
C.Based on the data in the graph above, what is your conclusion?
D.Why is a bar graph a good choice for presentation of these data? Would another type of chart be as effective?
Definitions:
Broca Area
A region in the frontal lobe of the brain associated with speech production, language processing, and language comprehension.
Visual Cortex
The visual cortex is the part of the cerebral cortex involved in processing visual information, located in the occipital lobe of the brain.
Premotor Area
A region of the frontal lobe of the brain involved in the planning and execution of movements.
Hemitransected
Refers to the process or state of being cut or transected half way through, often used in the context of biological or medical research.
Q6: Poverty is central to the problem of
Q12: Mitochondria are considered which of the following?<br>A)
Q22: Cooking destroys toxins that are present on
Q44: When infant mortality rates are high in
Q51: Oxytocin<br>A) causes let-down to occur.<br>B) causes morning
Q62: You are designing a study to assess
Q62: Which proteins assist in the movement of
Q64: "Glucose is transported from blood into cells
Q72: Proteins are described as having different levels
Q106: List the four major tissue types.Give an