Multiple Choice
Examine the graph below. 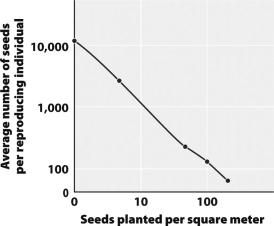
What statement best describes the relationship between planting density and seed production per individual plant?
Definitions:
Related Questions
Q3: Temperature differences drive air movement in the
Q19: Chaparral and grasslands are examples of _
Q29: A population of mice lives along a
Q34: _ have flexible arm joints, short snouts,
Q42: In the absence of _, nutrient recycling
Q44: An example of evolution that has been
Q51: Which pair of elements would make up
Q55: You are looking at the side of
Q74: Adaptive _ is the diversification of groups
Q76: Low levels of vitamin D have been