The figure below shows the cost curves of a firm in a competitive market. The firm always makes the choice to maximize its profit.
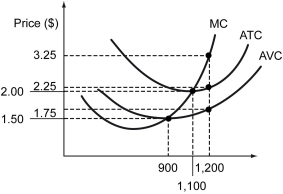
-Refer to the figure above.If the price is more than $1.50 but at most $2.00,the firm should produce ________.
Definitions:
Money Supply
The complete collection of monetary funds in an economy, including cash, coins, and the balances in checking and savings accounts, at a given moment.
Gold Coins
Coins made primarily or entirely of gold and used historically as currency, and today often collected as investments or keepsakes.
Small Denomination Time Deposits
Fixed-term deposit accounts offered by banks that have a lower minimum deposit requirement and are usually associated with lower interest rates.
Large Denomination Time Deposits
Savings accounts or certificates of deposit in large amounts, usually over $100,000, that earn interest over a fixed period of time.
Q46: Assume that the economy is in a
Q119: For any two indifference curves,the one on
Q119: Refer to the figure above.For what price
Q146: Define producer surplus.Calculate the producer surplus from
Q154: As the _ increases,_.<br>A) quantity demanded of
Q159: Refer to the scenario above.Who has a
Q163: In a market for apples,a consumer purchases
Q167: An economy produces apples and oranges.The dashed
Q182: Refer to the figure above.What is the
Q208: Refer to the figure above.In Prefecture B,the