The figure below shows the marginal cost (circles) and the average variable cost (crosses) of a firm in a competitive market. The firm always makes the choice to maximize its profit.
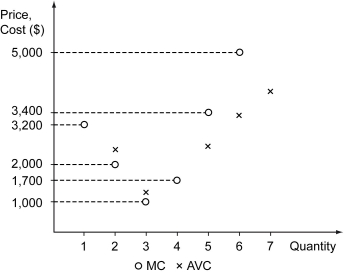
-Refer to the figure above.If the market price of the product fell from $5,000 to $3,400,what is the loss of the firm's producer surplus?
Definitions:
General Formula
A broadly applicable equation or rule that can be used in various situations to calculate a value or predict outcomes.
Slope
Slope is a measure of the steepness, incline, or grade of a line, often represented mathematically as the ratio of rise over run in the context of a graph.
Isocost Line
Represents all combinations of inputs that cost the same amount for a firm, illustrating budget constraints in production theory.
Price of Capital
The cost of using capital assets in production, which can include interest rates on loans or opportunity costs of using owned capital.
Q6: Which of the following statements is true?<br>A)
Q11: The profits of a firm equal _.<br>A)
Q56: The cross-price elasticity of demand for a
Q60: Refer to the table above.What is the
Q77: Refer to the table above.What is the
Q110: The entry of new firms into a
Q166: Refer to the table above.Derive the market
Q177: Which statement is consistent with the study
Q233: Refer to the scenario above.Which condition of
Q242: A machine can manufacture 1 unit of