The figure below shows the supply and the demand for a good (left) and the cost curves of an individual firm in this market (right) . Assume that all firms in this market, including the potential entrants, have identical cost curves. Initially, the market is in equilibrium at point A.
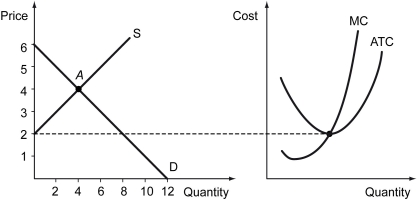
-Refer to the figure above.As firms enter or exit,the market will tend toward the long-run equilibrium,where each firm earns ________ at the price ________.
Definitions:
Q6: If a good has a price elasticity
Q12: Which of the following statements is true
Q51: Refer to the figure above.Suppose the world
Q72: A price ceiling imposed by the government
Q81: Which of the following statements differentiates between
Q102: The percentage change in the quantity demanded
Q114: Which of the following goods is likely
Q138: Refer to the scenario above.Suppose the equilibrium
Q161: Differentiate between the following.<br>a)Normal goods and inferior
Q193: Differentiate between perfectly elastic supply and perfectly