Scenario: The table below lists the willingness to pay for ten potential buyers of a Walter Payton rookie card and the willingness to accept for ten potential sellers of the card. (Walter Payton was a running back for the NFL's Chicago Bears from 1985 to 1987 and was elected into the NFL's Hall of Fame in 1993.) The graph below the table can be used to display the demand and supply schedules.
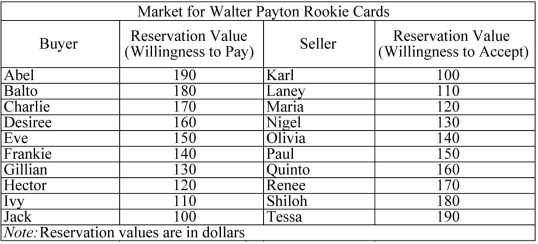
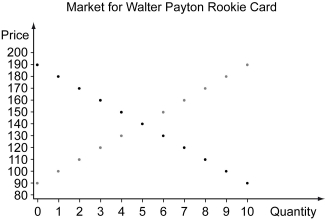
-Refer to the scenario above.In the graph above,plot the market demand schedule from the willingness to pay of buyers,and graph the market supply schedule from the willingness to accept of sellers.(Hint: Use the stairstep method similar to Exhibits 7.2 and 7.3 in the textbook; over and down for drawing market demand,and up and over for drawing market supply.)
Definitions:
Cleavage
Series of mitotic cell divisions, without growth, that converts the zygote to a multicellular blastula.
Meiotic Cell Divisions
A type of cell division that reduces the chromosome number by half, leading to the production of gametes in sexual reproduction.
Common Ancestor
The most recent ancestral form or species from which two different species evolutionary diverged.
Animals
Multicellular, eukaryotic organisms of the kingdom Animalia, characterized by their ability to move, consume organic material, and sense their environment.
Q27: Marginal cost is the _.<br>A) cost(s) a
Q35: Refer to the scenario above._ has comparative
Q61: Refer to the figure above.With currently available
Q96: The decrease in social surplus from a
Q134: A budget constraint is a straight line
Q138: Refer to the table above.When the _
Q143: Refer to the figure above.Should the market
Q177: Refer to the scenario above.If this firm
Q185: The consumption bundle that maximizes a consumer's
Q216: Refer to the figure above.At the profit-maximizing