The following figure shows the marginal cost curves of two profit-maximizing firms-Firm A and Firm B-in a perfectly competitive market.
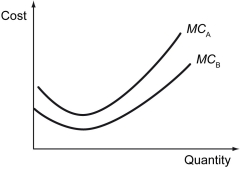
-Refer to the figure above.Which of the following statements is true?
Definitions:
Industry Expansion
The growth or increase in size and operations of an industry due to higher demand, technological advancements, or other factors.
Positive Revenues
Positive revenues refer to the income generated from sales, services, or other business activities before any expenses are subtracted, indicating a gross inflow of economic benefits.
Resources Move
Resources Move describes the reallocation or mobility of resources (labor, capital, etc.) from one sector, location, or use to another.
Alternative Production Techniques
Different methods or processes used in the production of goods and services, often evaluated for their efficiency, cost-effectiveness, or environmental impact.
Q45: Refer to the figure above.If the market
Q49: The output of a bakery is 250
Q54: Refer to the scenario above.The tariff revenue
Q96: a)The demand for shoes in Cadbia is
Q115: A production possibilities curve is plotted for
Q123: Which of the following is not a
Q143: Assume that the market demand for pens
Q174: Sofia is selling homemade cakes.The demand for
Q195: Refer to the scenario above.If you draw
Q227: Refer to the scenario above.The firm's average