Multiple Choice
The following figure depicts the short-run cost curves of a perfectly competitive firm.
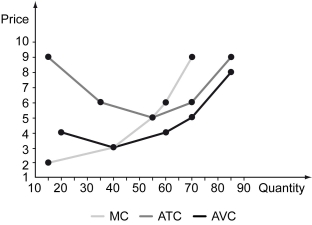
-Refer to the figure above.At the profit-maximizing level of output,totals are equal to ________.
Definitions:
Related Questions
Q18: Refer to the table above.Which of the
Q55: Refer to the figure above.What is the
Q72: The U.S.wheat market is represented by the
Q96: An economic agent _ when he accounts
Q104: Suppose a market has only one seller
Q115: A production possibilities curve is plotted for
Q135: A firm producing calculators and cell phones
Q171: In the following figure,BC is the budget
Q180: Refer to the figure above.What is the
Q223: Refer to the scenario above.What is the