The following figure represents the cost curves of two firms operating in different perfectly competitive industries. This economy consists only of industries 1 and 2.
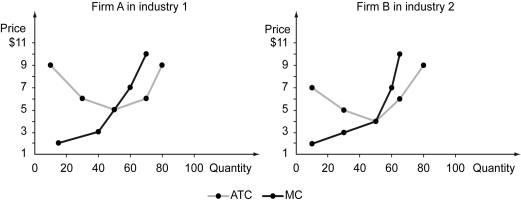
-Refer to the figure above.If the market price in industry 1 is $7 and the market price in industry 2 is $3,we should expect ________ in the long run.
Definitions:
Q40: Refer to the scenario above.What is the
Q178: Refer to the figure above.What is the
Q184: In a perfectly competitive market,all firms in
Q189: Refer to the figure above.Between the output
Q197: Refer to the table above.If the market
Q205: Refer to the figure above.If the world
Q233: If a seller's marginal cost is $25
Q246: Refer to the scenario above.Calculate the revenue
Q249: Refer to the scenario above.If the terms
Q258: Which of the following can be a