The following figure shows the demand and supply curves for a good. The initial demand curve is D₁ and the supply curve is S. Later, due to an external shock, the demand curve shifts to D₂.
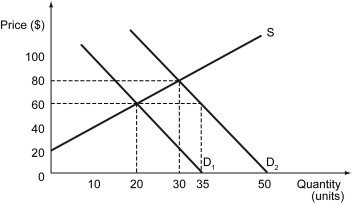
-Refer to the figure above.After the demand curve shifts to D₂,if the price is held below the new equilibrium,then ________.
Definitions:
Q15: In a perfectly competitive market,a marginal entrant
Q30: If a nation is a net importer,it
Q40: Refer to the scenario above.What is the
Q47: Refer to the figure above.If the market
Q72: Specialization is the result of _.<br>A) hiring
Q141: Refer to the scenario above.Which condition of
Q154: Refer to the figure above.In what scenario
Q166: When the price of one pen is
Q219: If a country is a price taker
Q249: A double oral auction is an auction