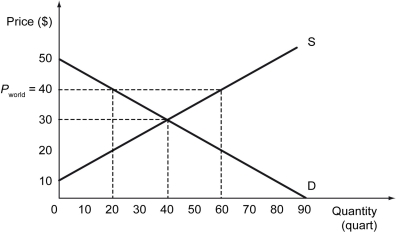
The following figure shows the demand curve, D, and the supply curve, S, for calculators in Barylia. The world price of calculators is $40.

-Refer to the figure above.What is the producer surplus before Barylia opens up to free trade?
Definitions:
Output Word
A data structure or unit in digital electronics and computing used to represent output values or states.
Sequencer Program
A computer program designed to manage the execution order of other programs or instructions in a sequence.
Sequencer Instructions
Instructions used in PLC programming to execute a series of operations or control a process step by step.
Retentive
Pertaining to a device or process that retains its state or data even after power is lost or reset.
Q58: Define "reservation values." If a buyer of
Q81: Which of the following statements differentiates between
Q134: Refer to the figure above.If the market
Q137: Which of the following best describes a
Q145: A market economy produces the optimal amount
Q162: Refer to the scenario above.What is the
Q173: Refer to the scenario above.What is the
Q181: When buyers and sellers optimize in a
Q222: Refer to the scenario above.Taking into account
Q236: The demand for chocolate is perfectly inelastic