The following figure depicts four different scenarios in which the blue line represents California's production possibilities curve (PPC) and the red line represents Texas' PPC. These two states trade wine and cloth.
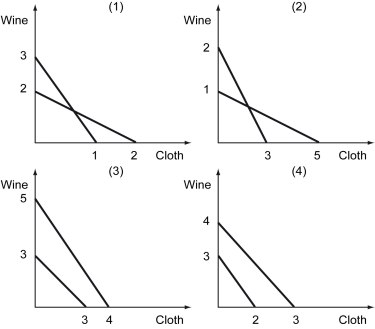
-Refer to the figure above.In what scenario would the terms of trade of cloth for wine be between 1 and 1.25?
Definitions:
Free Trade
An economic policy of not discriminating against imports from and exports to foreign jurisdictions, allowing goods and services to move freely across borders.
Trade Barriers
Measures that governments or public authorities introduce to make imported goods or services less competitive than locally produced goods and services.
Specialization
Refers to the process where individuals, businesses, or countries focus on producing a narrow range of goods or services, improving efficiency and productivity.
Production Possibility Frontier
A curve depicting all maximum output possibilities for two or more goods given a set of inputs (resources), representing the trade-off between different choices.
Q82: The table below shows the income tax
Q107: Refer to the scenario above.Before the tariff
Q128: Refer to the figure above.If the pre-tax
Q166: Refer to the table above.If the world
Q167: Suppose you live in a housing co-op
Q193: Refer to the figures above.When Banana Republic
Q204: Refer to the figure above.If the demand
Q206: Which of the following suggests that a
Q214: A buyer is willing to buy 10
Q219: Which of the following taxes does NOT