Multiple Choice
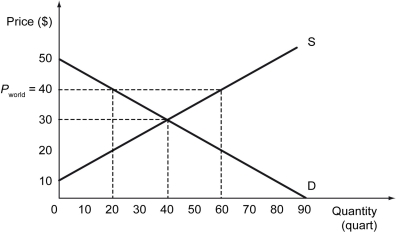
The following figure shows the demand curve, D, and the supply curve, S, for calculators in Barylia. The world price of calculators is $40.

-Refer to the figure above.What is the total surplus after Barylia opens up to free trade?
Definitions:
Related Questions
Q35: Refer to the figure above.The region PCCAF
Q36: Refer to the figure above.Which of the
Q49: Refer to the scenario above.Which of the
Q54: The marginal cost and total revenue of
Q77: Refer to the figure above.Assuming that the
Q123: Which of the following is not a
Q141: Refer to the figure above.What is the
Q150: Refer to the scenario above.The market equilibrium
Q204: Consider a market with a price ceiling
Q208: How do perfectly competitive markets allow for