The following figure shows the supply and demand curves in a competitive market for a good. The government is considering a $1.50 tax on this good.
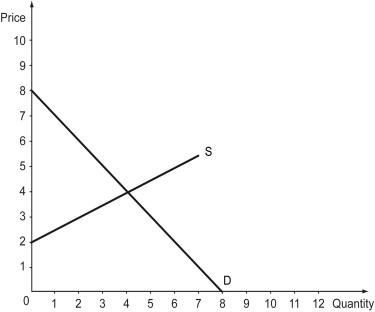
-Refer to the above figure.If the $1.50 tax is collected from the producers of this good,how many units of it will be supplied to the market?
Definitions:
Q9: Refer to the figure above.Social surplus will
Q10: How is the demand curve faced by
Q15: Which of the following correctly identifies an
Q41: What are the objectives of government taxation
Q79: When the price of laundry detergent is
Q80: Efficient government intervention requires that _.<br>A) the
Q120: Refer to the figure above.The incidence of
Q162: Which of the following is collected only
Q223: _ taxes represent about a third of
Q230: The value of the marginal product of