The following figure shows the demand curve and the marginal revenue curve (MR)faced by a monopolist.The monopolist has a constant marginal cost of $3.
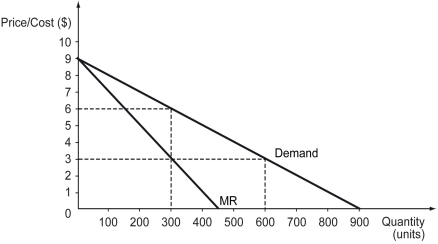
Calculate consumer surplus,monopoly's surplus,and deadweight loss.
Definitions:
Total Cost
The entire cost of production, including both fixed and variable costs.
Maximize Profits
An objective of firms where they seek to achieve the highest possible financial gain from their operations, often by optimizing production and sales strategies.
Supply Function
A mathematical equation or curve that shows the relationship between the price of a good and the quantity supplied.
Production Function
An economic model that describes the relationship between inputs used in production and the output of those goods or services.
Q27: Takashi,an Asian,and Sally,a Caucasian,apply for a job
Q37: Suppose you and your roommate are trying
Q105: Refer to the figure above.What is the
Q163: Which of the following is likely to
Q180: When a monopolist sells positive levels of
Q185: Land is _.<br>A) an artificially created input
Q196: Collusion can work if _.<br>A) a colluder
Q205: Refer to the figure above.In the short
Q222: Refer to the figure above.If the monopolist
Q290: Refer to the table above.What is the