The following figure shows the demand curve and the marginal revenue (MR)curve of a monopolist supplying petroleum.
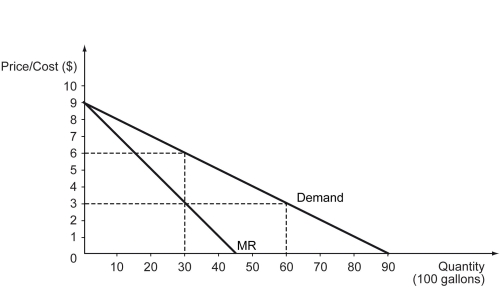
a)If the monopolist faces a constant marginal cost of $3,what is the optimal output that it should produce?
b)If the monopolist faces a constant marginal cost of $3,at what price should it sell the optimal output?
c)If the average total cost of the monopolist is $4 per gallon when it produces the optimal output,determine its profit or loss.
Definitions:
Theory
A system of ideas intended to explain something, based on general principles independent of the thing to be explained.
Comprehensive Model
A comprehensive model is an extensive and inclusive framework or theory that aims to explain a wide range of phenomena or variables within a particular domain.
Personality Constructs
Theoretical models or concepts used to describe and understand the various aspects and dimensions of human personality.
Assessment
The process of evaluating or measuring the knowledge, skills, abilities, or characteristics of an individual or group.
Q4: Refer to the figure above.In the short-run,the
Q42: Refer to the scenario above.When Tobac Co.'s
Q51: Game theory is the study of _.<br>A)
Q59: Refer to the scenario above.Which of the
Q105: Refer to the figure above.Refer to the
Q119: Which of the following is a difference
Q132: Which of the following statements is true?<br>A)
Q141: Citizens can safely conduct their economic activities
Q188: What does the term "commitment" refer to
Q188: Which of the following is a likely