The following figure shows the market demand curve for penicillin, an antibiotic medicine. Initially, the market was supplied by perfectly competitive firms. Later, the government granted the exclusive right to produce and sell penicillin to one firm. The figure also shows the marginal revenue curve (MR) of the firm once it begins to operate as a monopoly. The marginal cost is constant at $3, irrespective of the market structure.
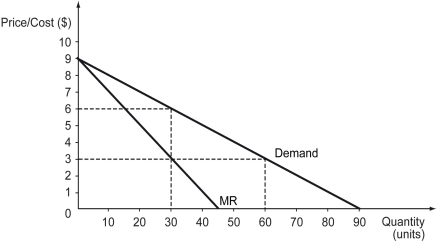
-Refer to the figure above.What is the price that the monopolistic firm would charge?
Definitions:
Completion of Sale
This term signifies the point at which a transaction is finalized, and all conditions for the sale have been satisfied, transferring ownership from seller to buyer.
Q2: What is a welfare state?
Q7: Refer to the scenario above.If Miguel's truck
Q75: Which of the following situations is an
Q125: Refer to the graph above.If the government
Q128: Labor demand is described as a derived
Q148: At the profit-maximizing level of output and
Q161: When expectations cause people to discriminate against
Q176: Which of the following is likely to
Q201: The flatter (more relatively elastic)is the residual
Q205: A person's stock of skills to produce