Multiple Choice
The following figure shows the demand curve, the marginal revenue (MR) curve, the marginal cost (MC) curve, and the average total cost (ATC) curve of a monopolist.
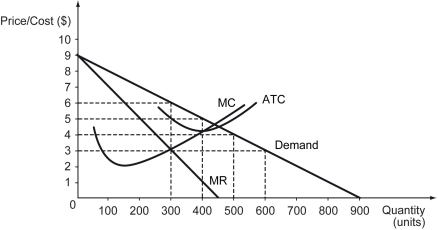
-Refer to the figure above.When the monopolist is free to set the price,________.
Definitions:
Related Questions
Q2: The firms in a monopolistic competition market
Q24: Refer to the figure above.If this monopolist
Q138: Which of the following statements is true?<br>A)
Q145: Which of the following is an example
Q157: Assume that both the goods and the
Q171: The pricing rule for a monopolist who
Q177: Everything else remaining unchanged,if a new seller
Q203: You are good at creating Web sites.You
Q219: Refer to the scenario above.If in equilibrium
Q229: Based on research conducted on the productivity