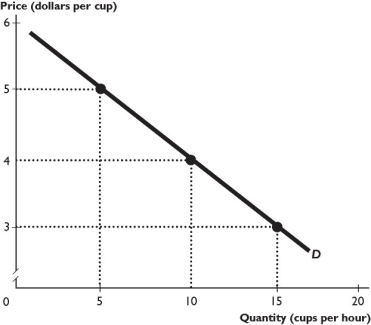
The figure above shows the demand curve for Starbucks latte.
-Using the figure above,suppose Starbucks charges $4.50 per cup for its latte.Which of the following is true?
i.At this price,the demand for Starbucks latte is elastic.
ii.If Starbucks lowers the price of its latte,its revenue will decrease.
iii.If Starbucks raises the price of its latte,the demand for it will become less elastic.
Definitions:
Economic Policies
Strategies and decisions implemented by a government or organization to influence its economic performance and social welfare.
Citizen Apathy
A situation where individuals in a society do not show interest or concern for the political, social, or cultural life of their community.
Massive Deficits
Significantly large shortfalls where government expenditures exceed revenue.
Surpluses
Situations in which the quantity of a product or service supplied exceeds the quantity demanded, or when revenues exceed expenditures in a budget.
Q10: When society produces the combination of goods
Q44: What approach to fairness argues in favor
Q89: If the number of companies producing memory
Q120: The point that each glass of lemonade
Q246: Ben's cost of making an additional rocking
Q252: The demand for necessities generally is _
Q270: When income increases from $20,000 to $30,000
Q276: Goods are _ when the income elasticity
Q285: For a product with a constant or
Q292: In the figure above,the demand is inelastic