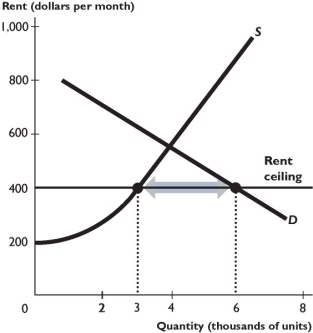
The figure above shows the supply and demand curves in the market for rental housing. A rent ceiling is set at $400 per month.
-In the figure above,with the rent ceiling ________ units of housing are available,and black market rents might be as high as ________ a month.
Definitions:
Dividends
Payments made by a corporation to its shareholders, usually as a distribution of profits.
Retained Earnings
The portion of net earnings not distributed as dividends to shareholders but retained by the company to reinvest in its core business or to pay debt.
Net Income
The total profit of a company after all expenses, taxes, and costs have been deducted from total revenue.
Dividend
A payout of a portion of a company's earnings, decided by the board of directors, to a class of its shareholders.
Q20: The above figure shows the U.S.market for
Q61: A price ceiling<br>A) creates market efficiency by
Q89: A minimum wage set above the equilibrium
Q93: If an import quota is imposed on
Q106: The above figure shows the U.S.market for
Q107: The above figure shows the labor market
Q111: In the figure above,the equilibrium market price
Q112: The graph shows the market for textbooks.If
Q184: _ tax is progressive if the _.<br>A)
Q215: A tax on income from land in